
Echo Index archive
The week of 14 September 2026
XMR is rhyming with 2020 XBTUSDT — its precedents went bullish
What this reading said
On 14 September 2026, Chart Echo measured 400 liquid stock and crypto charts against the historical archive. Each chart’s most recent 90 daily closes were matched against decades of price history, and the closest precedents were read for what they did next. That week, 70% of measured charts had precedent sets that leaned bullish, 20% leaned bearish, and 10% came back split.
The precedents behind it
Spotlight: XMR
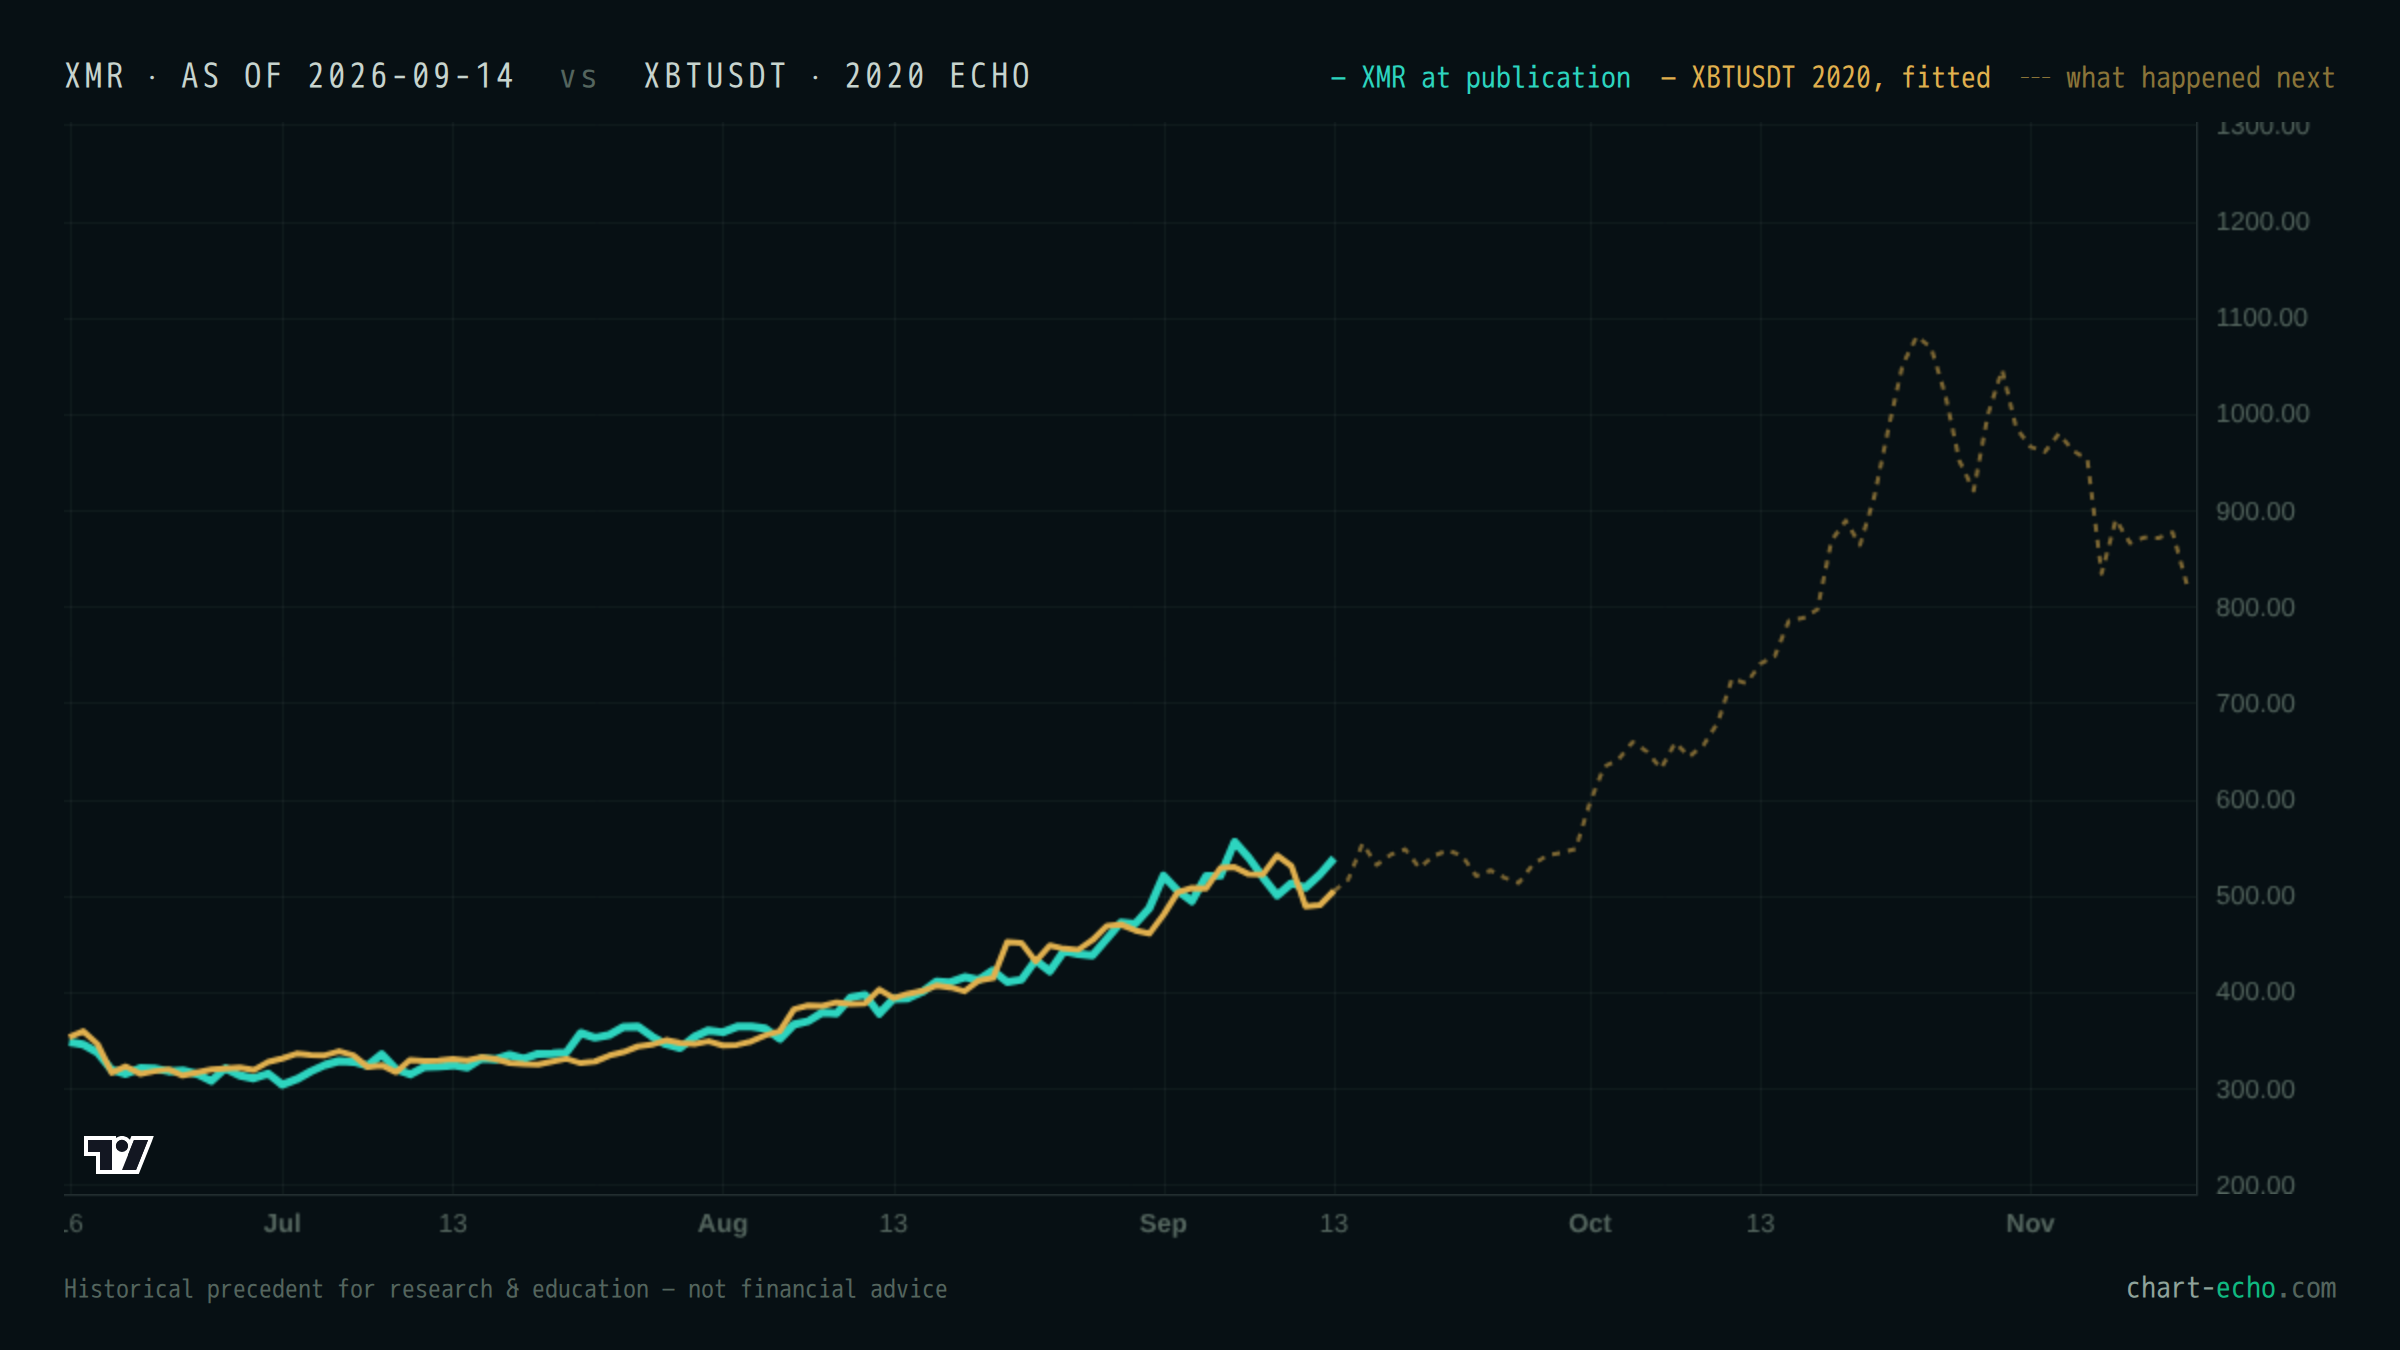
XMR’s window most closely resembled XBTUSDT (2020-08-31 → 2020-11-28), a 75% match. That single precedent, the one charted, moved +71.4% over the following 60 sessions. Across all 25 closest precedents, 72% resolved up and 20% down, with a median move of +30.65%.
Where the archive disagreed: USDT
USDT’s window most closely resembled ICXXBT (2020-04-30 → 2020-07-28), a 70% match. Across all 25 closest precedents, 48% resolved up and 48% down, with a median move of -0.78%.
Reading this in hindsight
This page is a permanent record of what the archive said at the time — it is not updated as the market resolves. That is the point: a precedent-based reading is only honest if it stays fixed after publication. A high bullish share was never a forecast that the market would rise; it recorded that most measured charts resembled history that had risen. Method and limits are documented in Methodology & limits.