Active traders
Before you take a setup, see the closest historical analogs and how they resolved over the following weeks - odds, average move, and typical drawdown.
Your chart has happened before
Search any S&P 500 stock or major crypto. Chart Echo finds the closest patterns in market history, then shows the outcomes that followed - the upside, downside, and odds in between.
Run your first echo


Chart Echo also has a guided mobile experience for checking setups away from the desk.
What is Chart Echo?
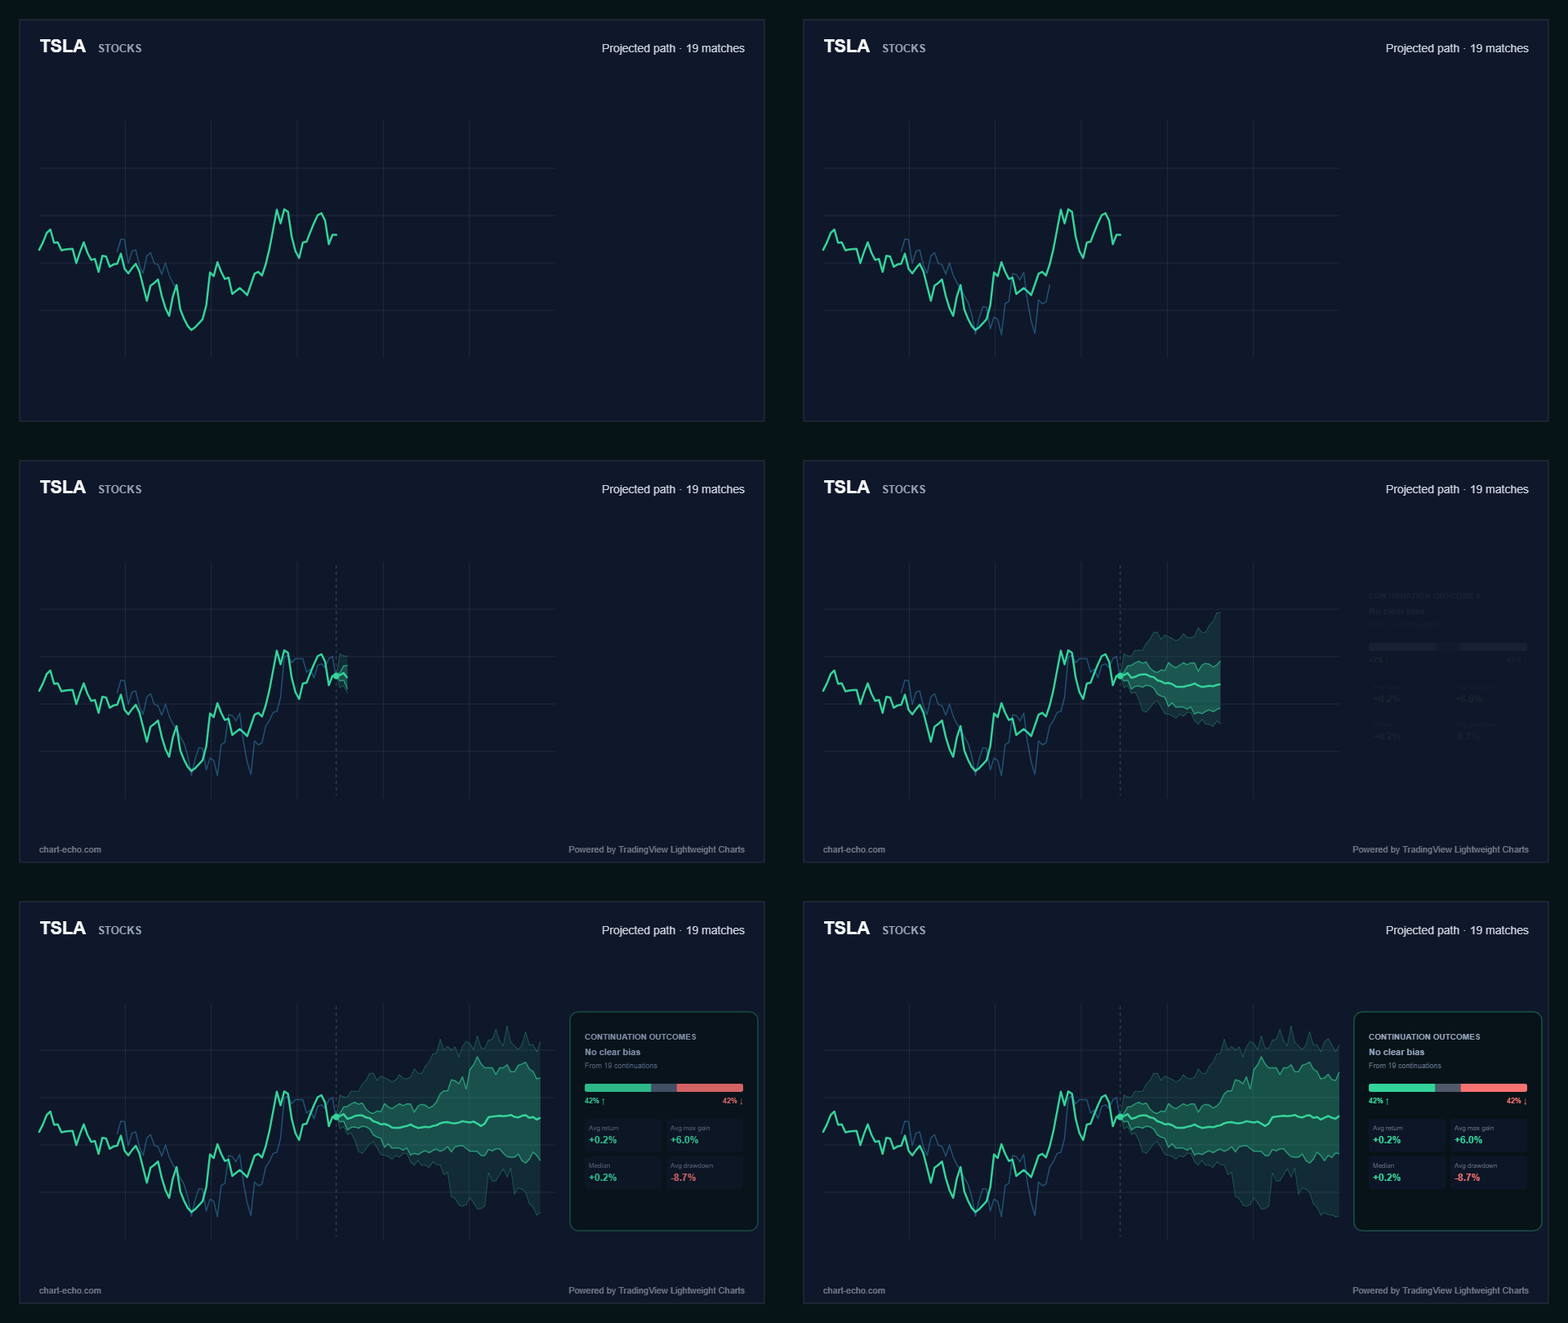
Every chart has rhymed before. Markets move in patterns that repeat - a base, a breakout, a blow-off top, a capitulation low. Chart Echo takes the shape of the chart you’re looking at right now and searches roughly 450 million historical windows across stocks and crypto to find the moments that looked most like it.
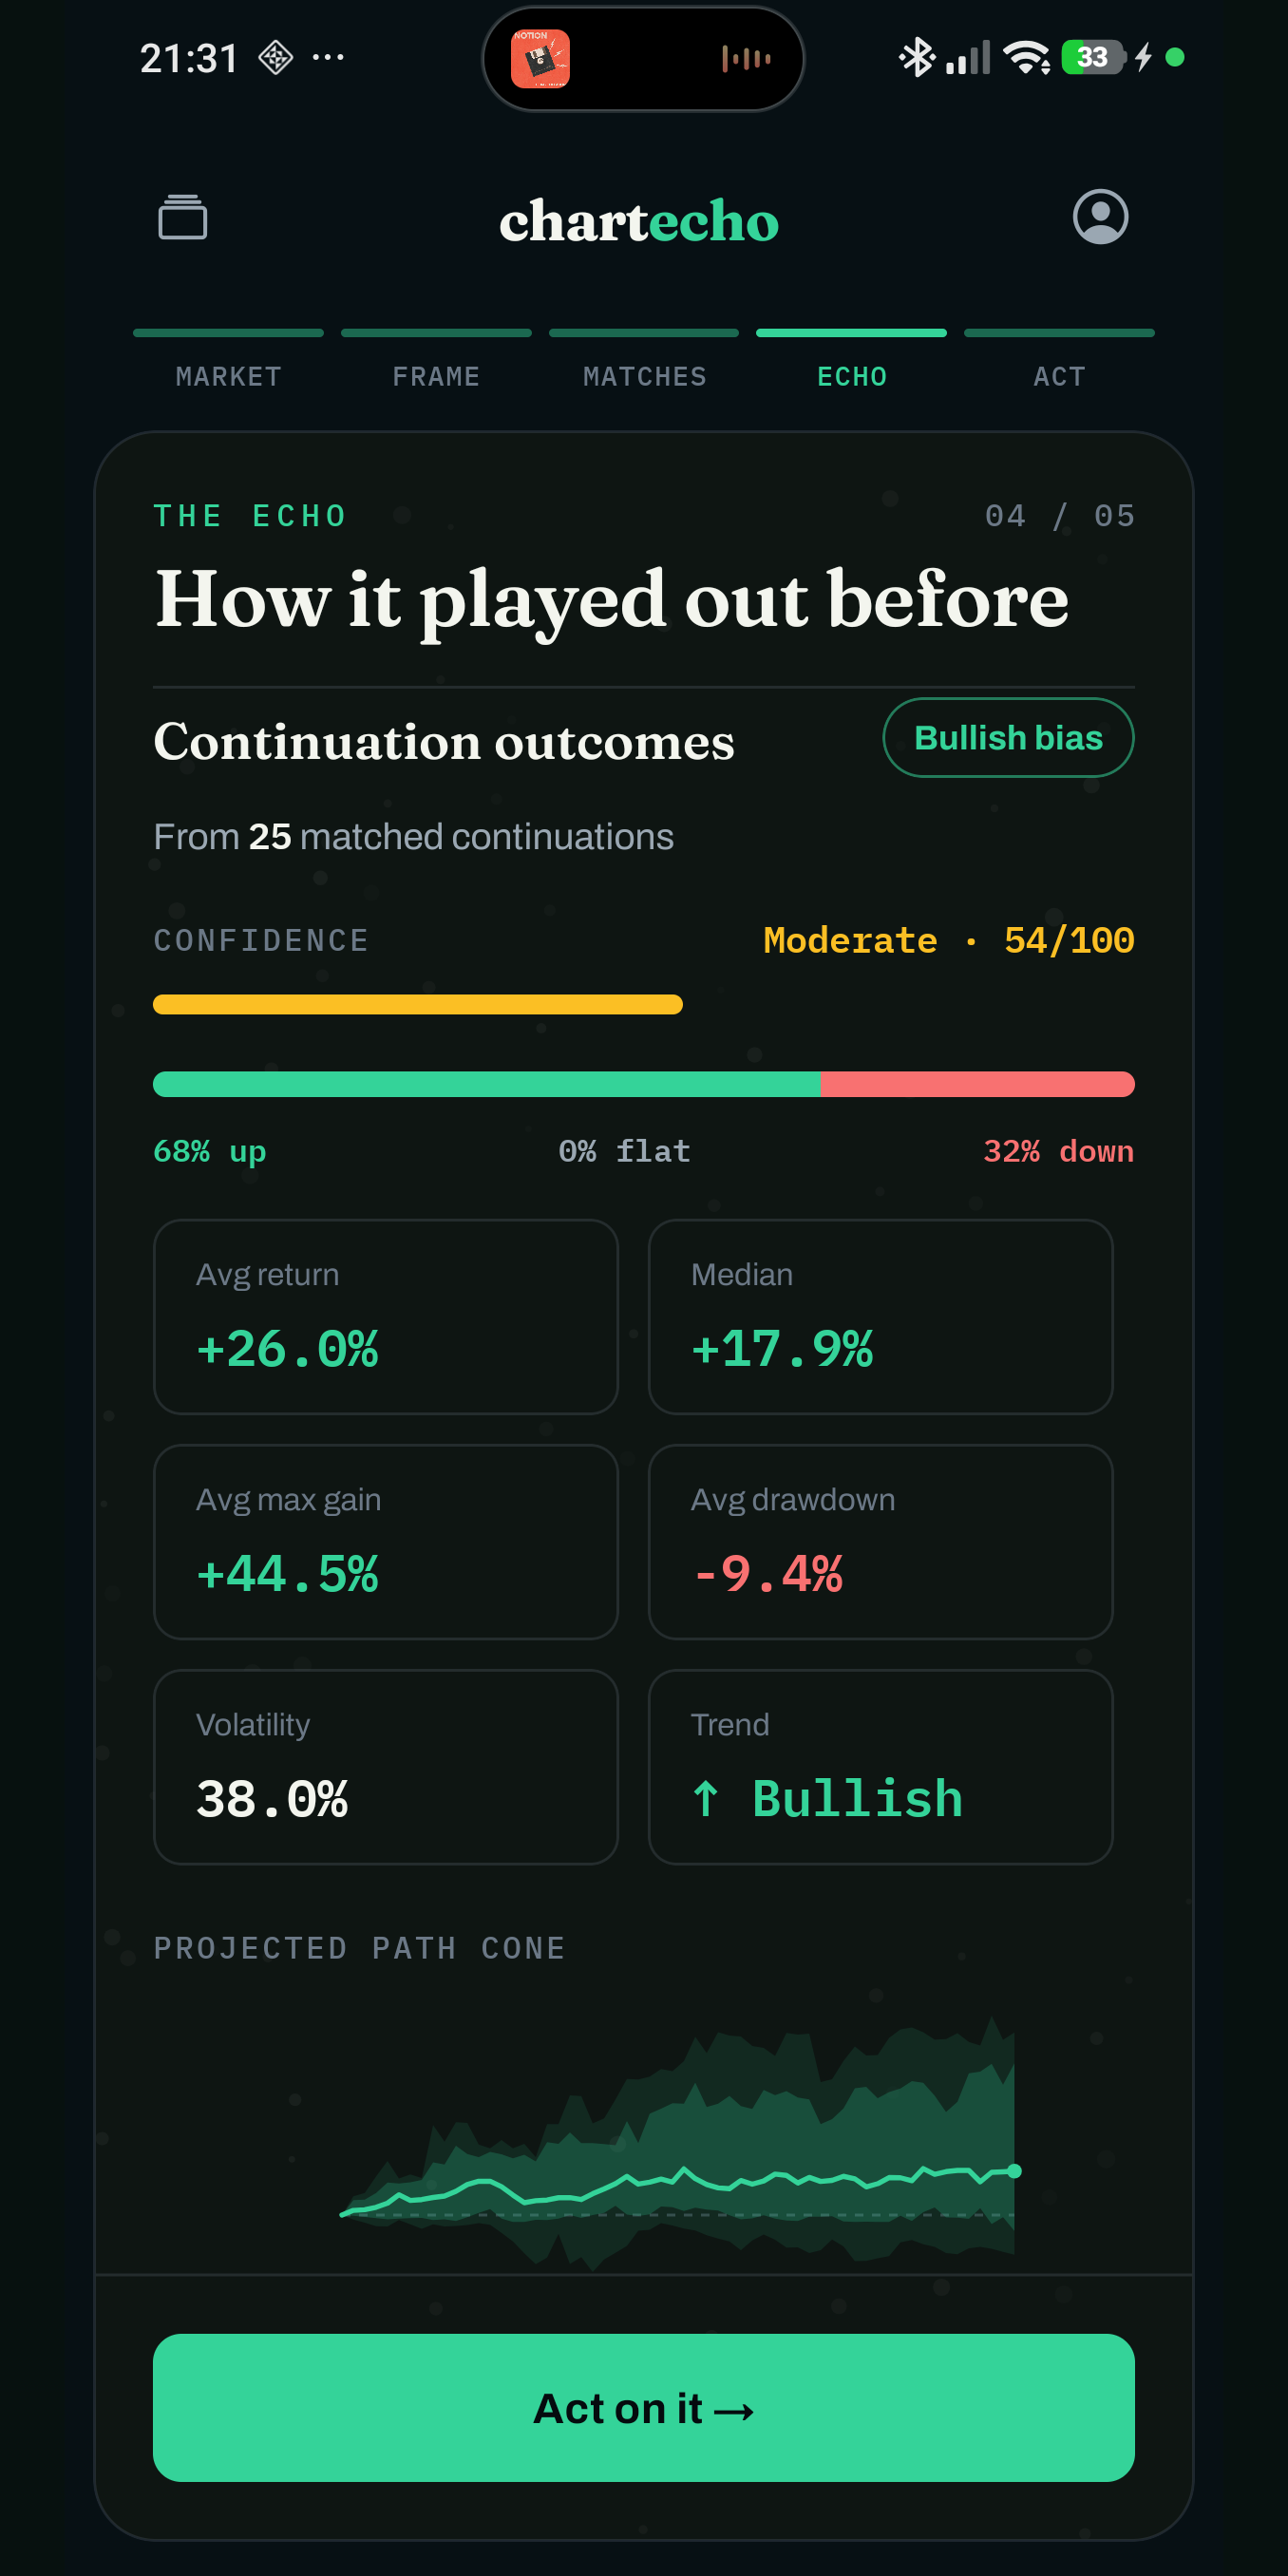
Then it does the part that actually matters: it shows you what happened next. Each historical match carries its own future - the days and weeks that followed. Aggregate those continuations and you get an honest, data-grounded picture of the odds: how often setups like this rose, fell, or went nowhere, the average move, and the typical drawdown along the way.
It is not a prediction, and it is not financial advice. It’s the market’s own memory, organised so you can study precedent in seconds instead of scrolling decades of charts by hand. Read the full walkthrough →
The flow
The app walks you through a single, guided path - the same flow as the Chart Echo mobile app. No blank canvas, no guesswork.
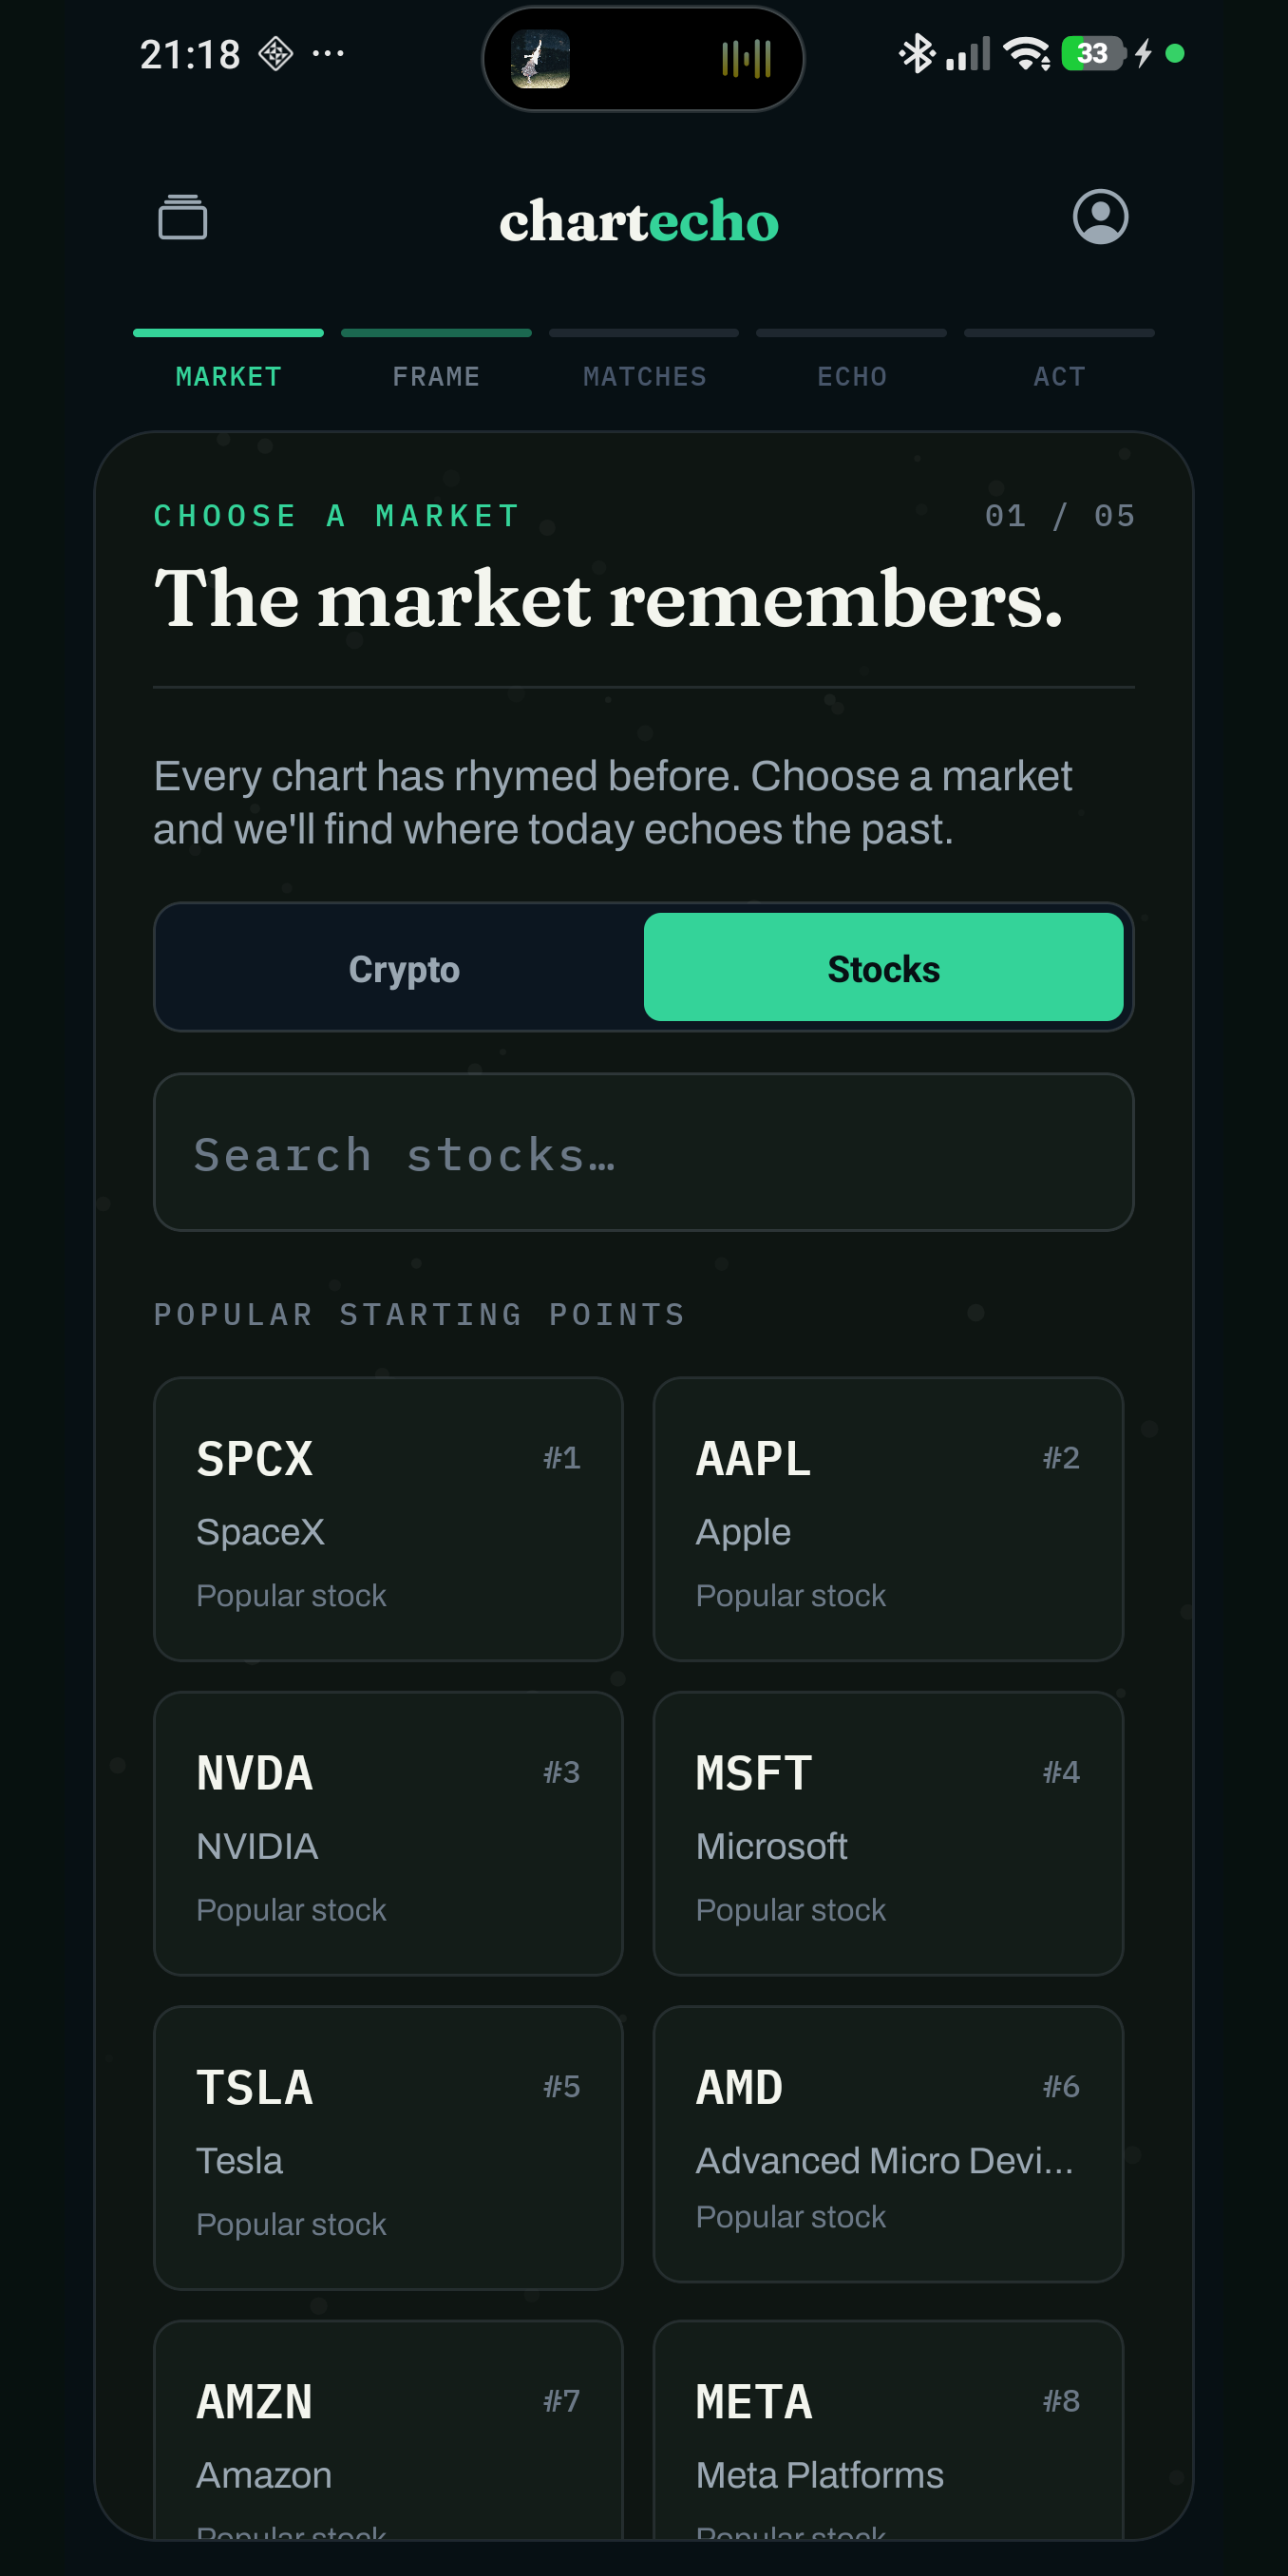
Pick the stock or crypto you’re watching - search it or tap a popular starting point.
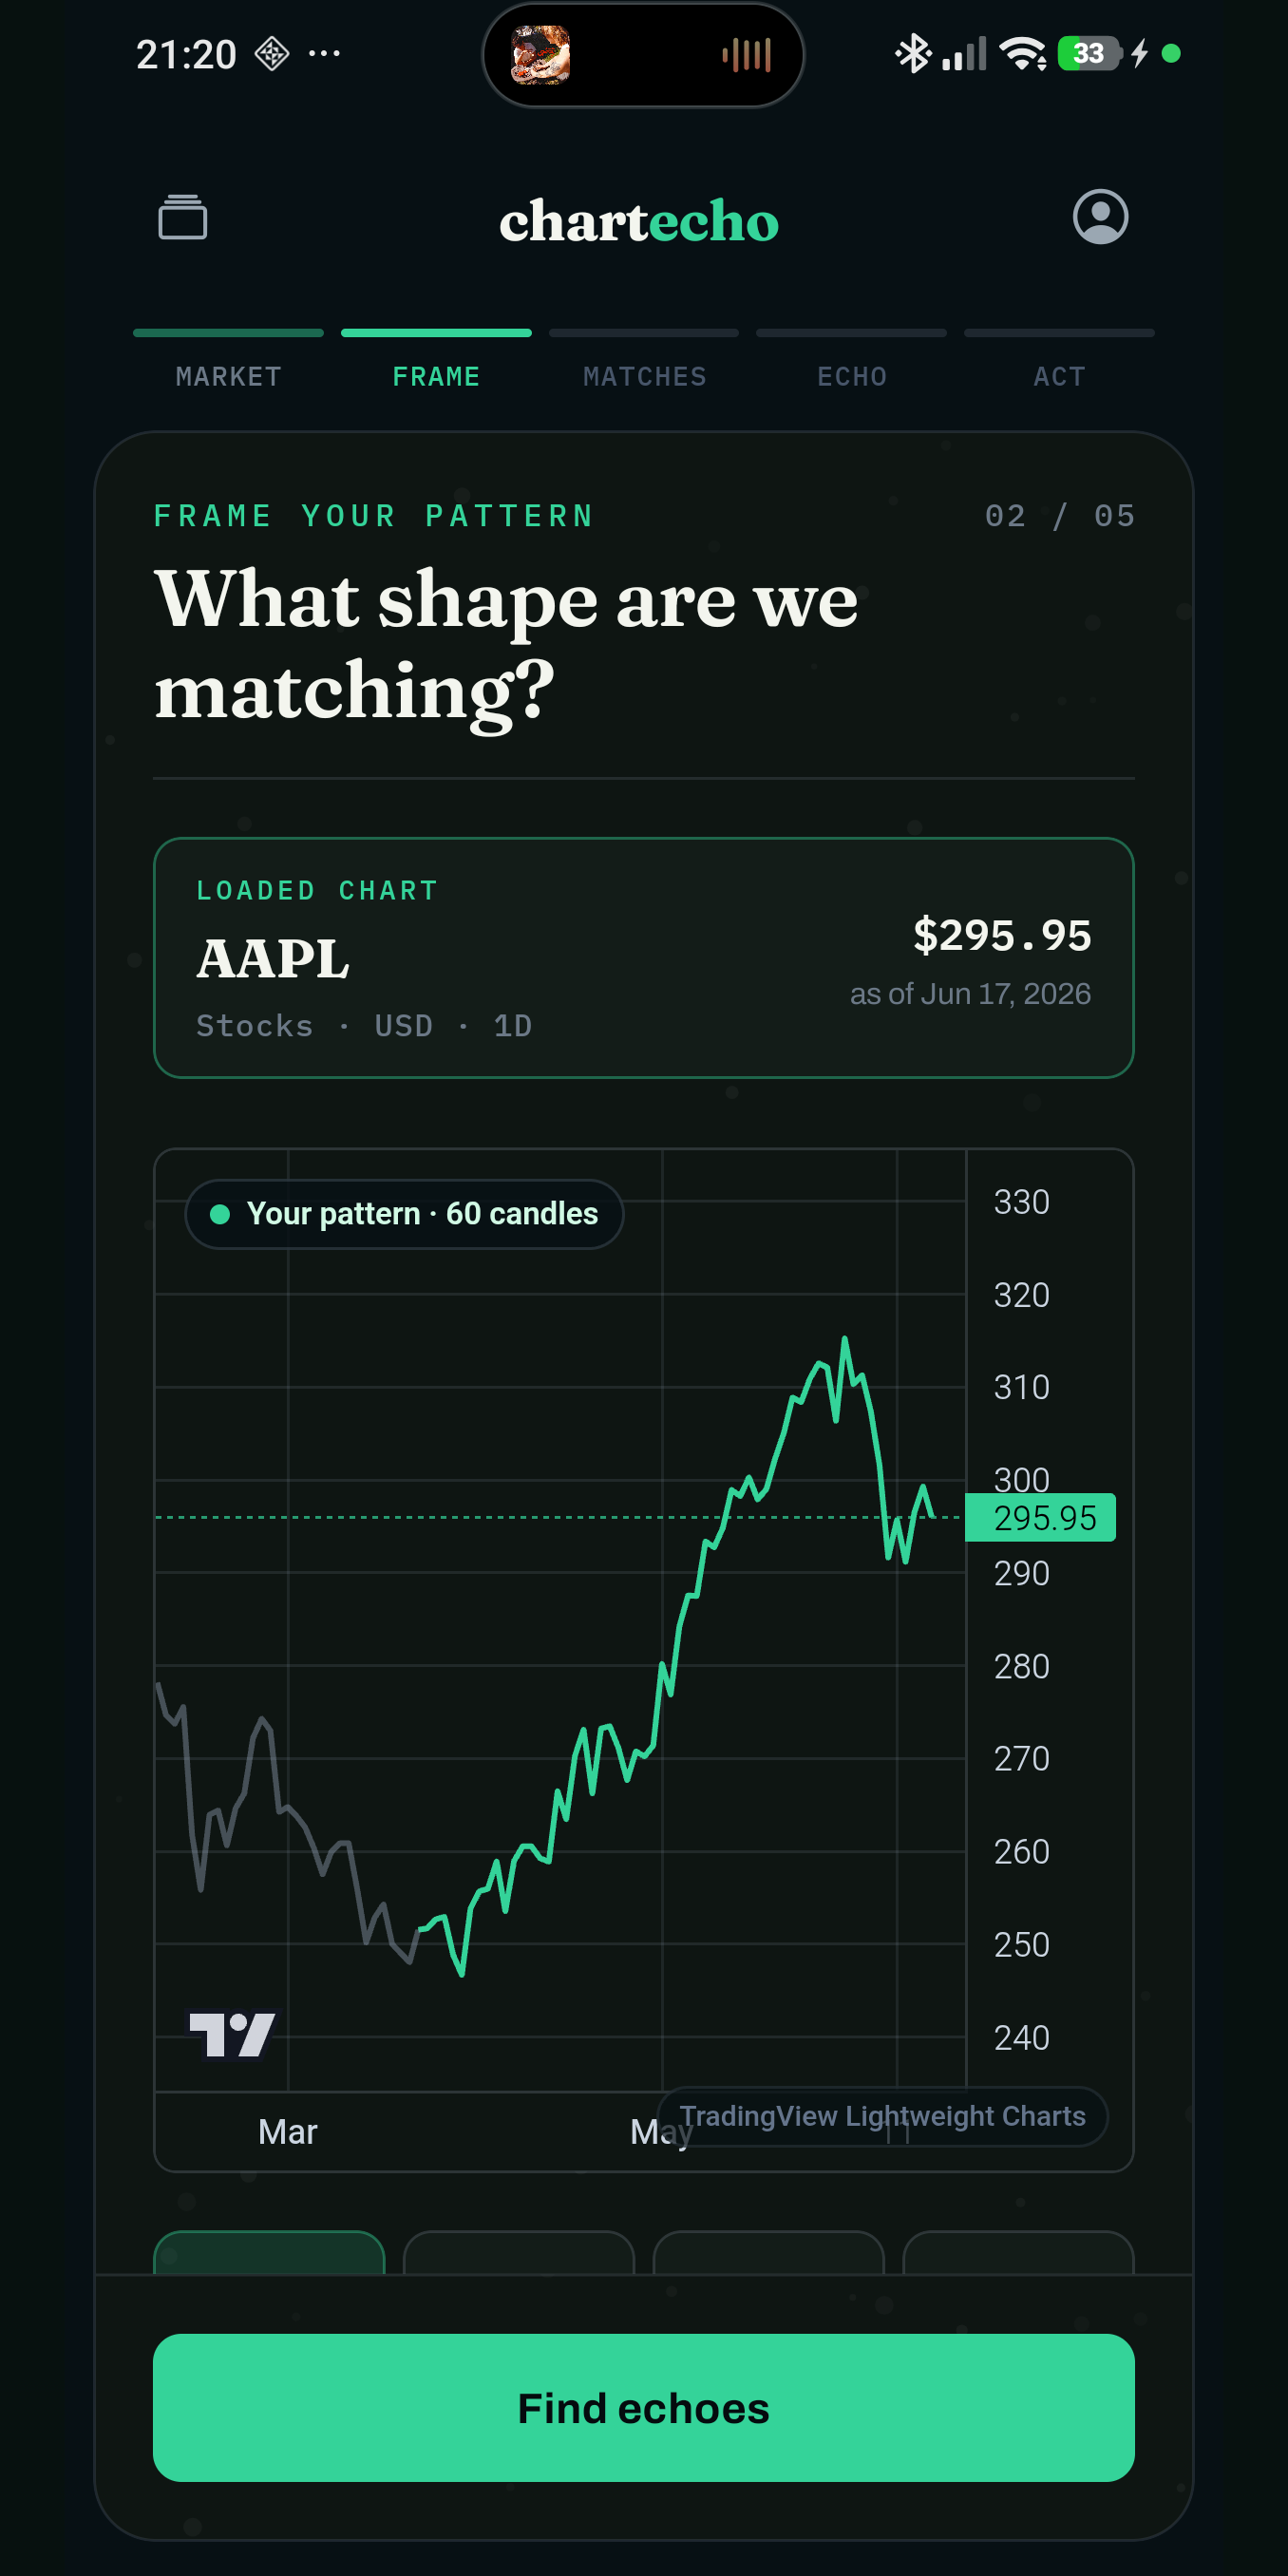
Set the timeframe and how many candles define “the pattern”, then run the search.
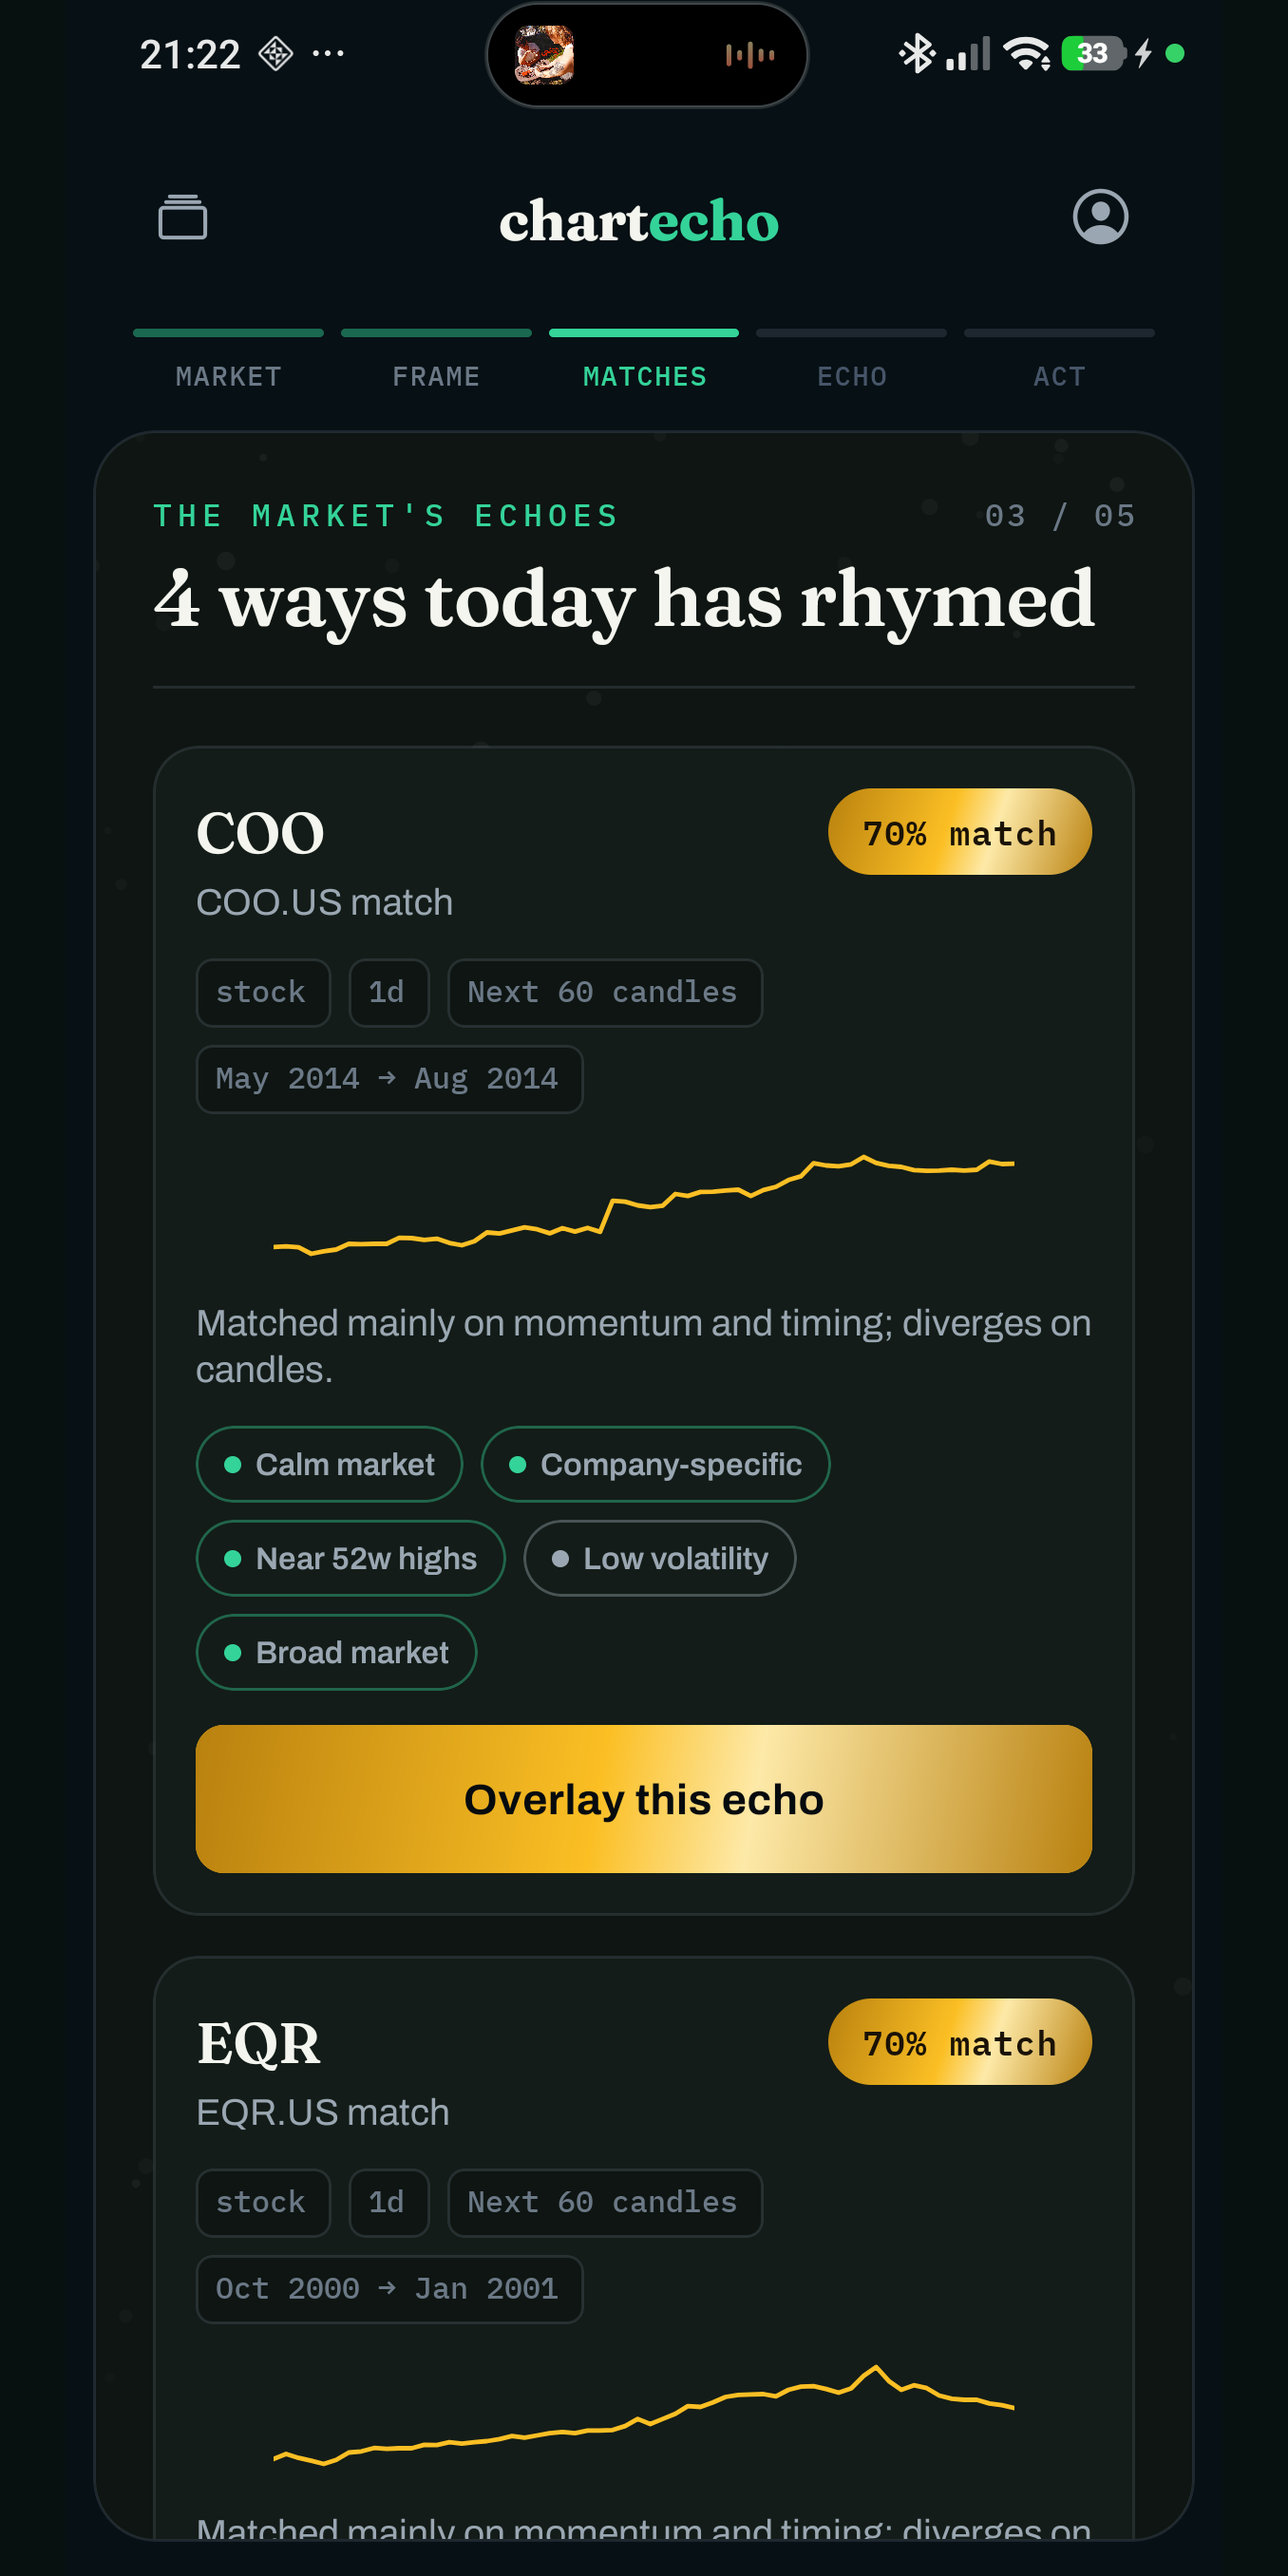
A ranked list of historical echoes - each with why it rhymes and how strongly.
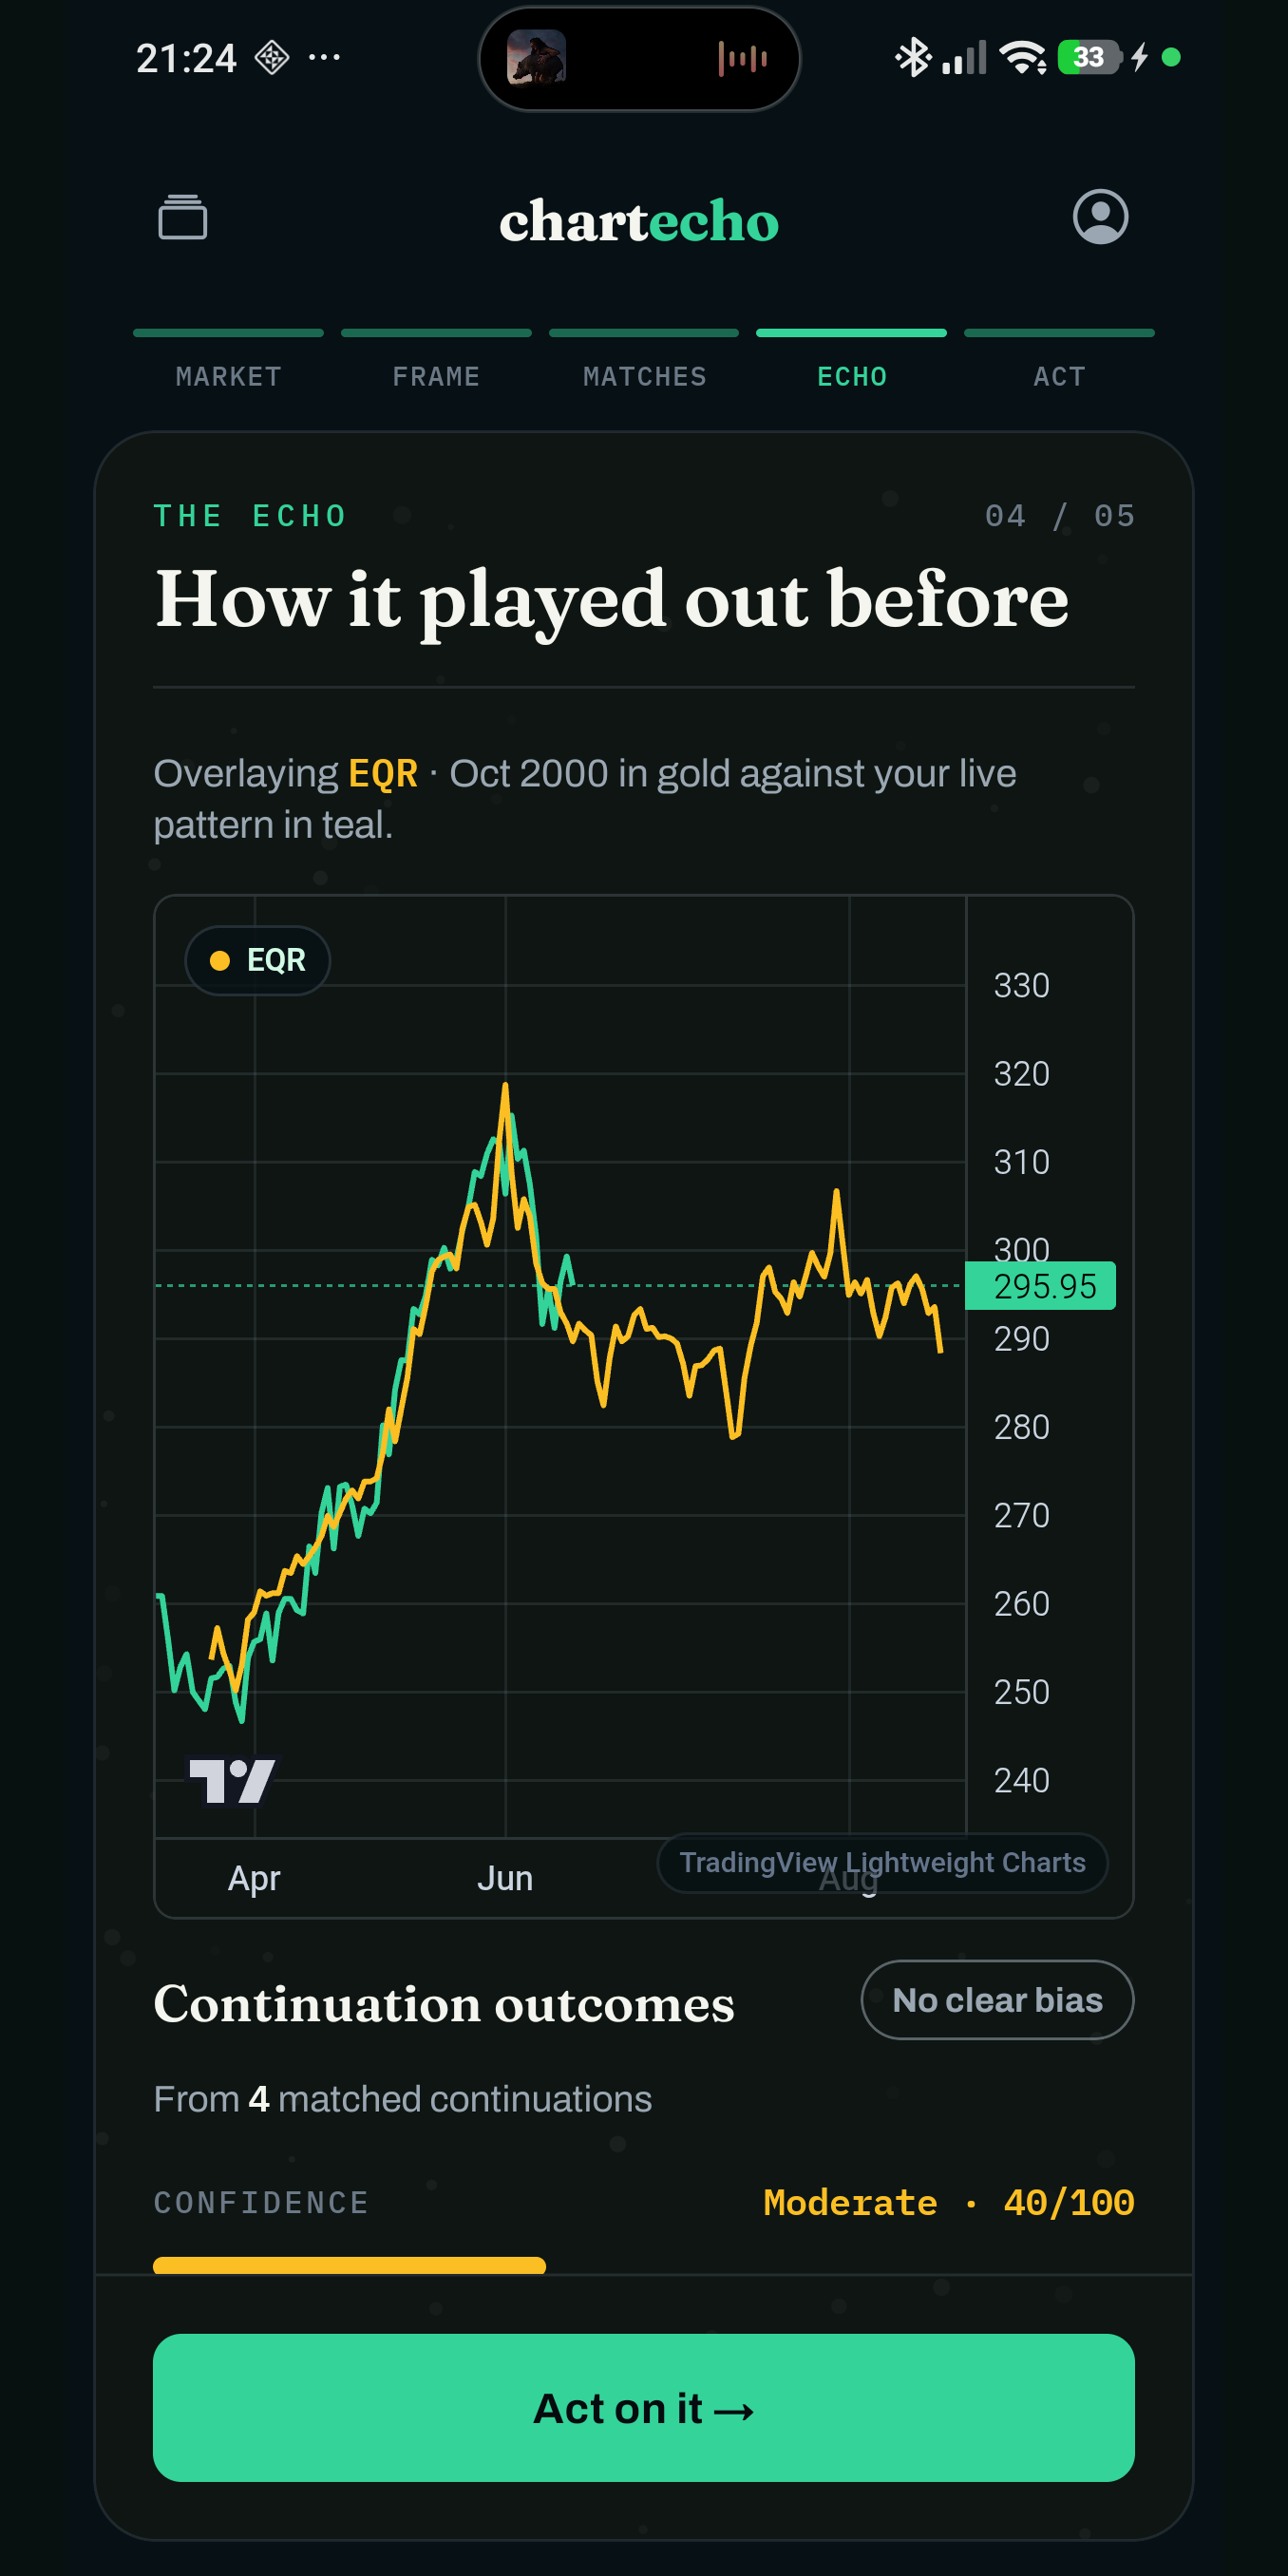
Overlay a match in gold against your live pattern and read the outcome statistics.
Save the workspace, set a reminder, watch for new fractals, or share a Story GIF.
Who it’s for
Before you take a setup, see the closest historical analogs and how they resolved over the following weeks - odds, average move, and typical drawdown.
Sanity-check a breakout or a sell-off against decades of precedent instead of one pundit’s opinion. Let the market’s own history frame the decision.
Crypto rhymes hard. Match BTC, ETH and the majors against their own past structure and across assets to spot where today has happened before.
Why Chart Echo
Pick a stock or crypto ticker and instantly get the closest historical chart patterns. No indicators to configure, no scanners, no custom models.
Find setups that look like yours and see how they actually played out - with outcome odds, not vibes. One clear question, one clear answer.
Free to start with no account required. Accounts unlock saved workspaces; Premium adds Pro Mode, saved-setup reminders, intraday timeframes, alerts, and watermark-free exports.
Premium market discovery
You do not always know which ticker is worth searching. Echo Radar scans the S&P 500 and the top 25 cryptocurrencies every day, then ranks the charts with the clearest historical lean.
Example scan - historical leans are not trade recommendations.
Go deeper
We explain exactly how fractal matching works, how outcome statistics are computed, and where the limits are - in plain language.
Free, anonymous, and instant. No account needed to start.
Open the chart workspaceFor research and education only - not financial advice.